AMMnet Hackathon Session 1: Introduction to Data Visualization in R
Published: 19/07/2024
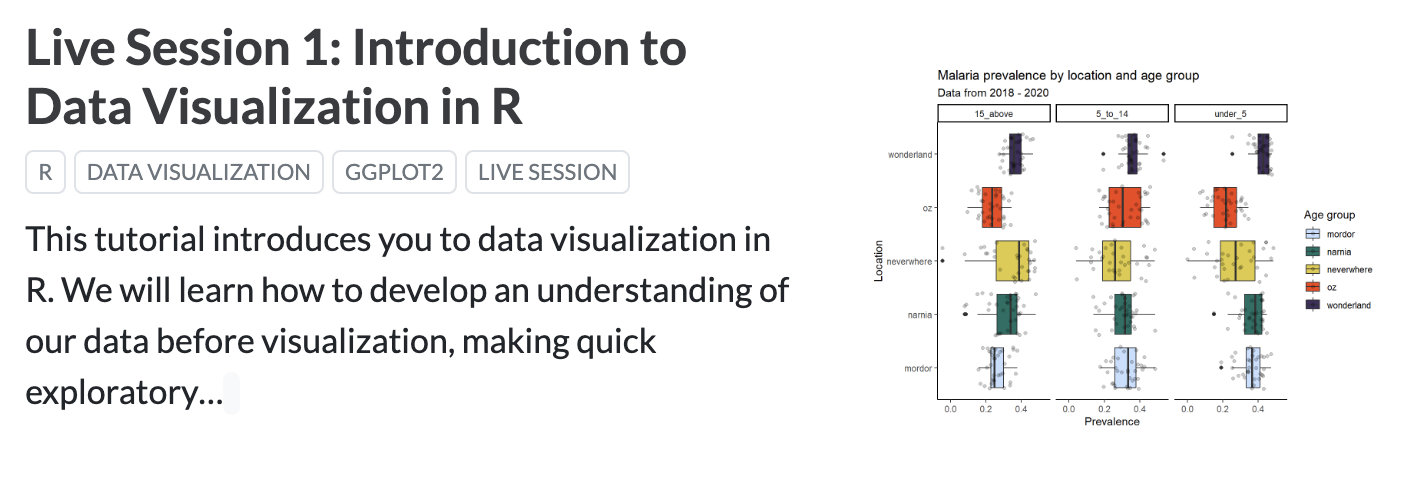
This tutorial introduces you to data visualization in R. We will learn how to develop an understanding of our data before visualization, making quick exploratory visualizations using base R functions, and creating various plots using the ggplot2 package. You’ll learn how to customize and enhance your visualizations for clear data communication. By the end, you’ll have the skills to create plots to effectively present your data insights.
The AMMnet Hackathon blog is a continual support space that anyone can access to learn how to code and how to code better, to upskill people from a distance and improve abilities in data handling, presentation and analysis, experimental design, quantitative understanding, coding and problem solving and transmission modelling.
Published: 19/07/2024
THEMES: Capacity Building | Modeling
Related Resources